Infographics: Making Data Visual
Let’s be honest—nobody wants to read a massive wall of text or stare at a dry spreadsheet. My goal with infographics is to take complex data, deep research, or technical steps and turn them into a clean, engaging visual story that anyone can understand at a glance.
Here is how I bring information to life:
The Deep Dive: You supply the raw data, the research copy, or the project brief, and I figure out the best way to map it out visually.
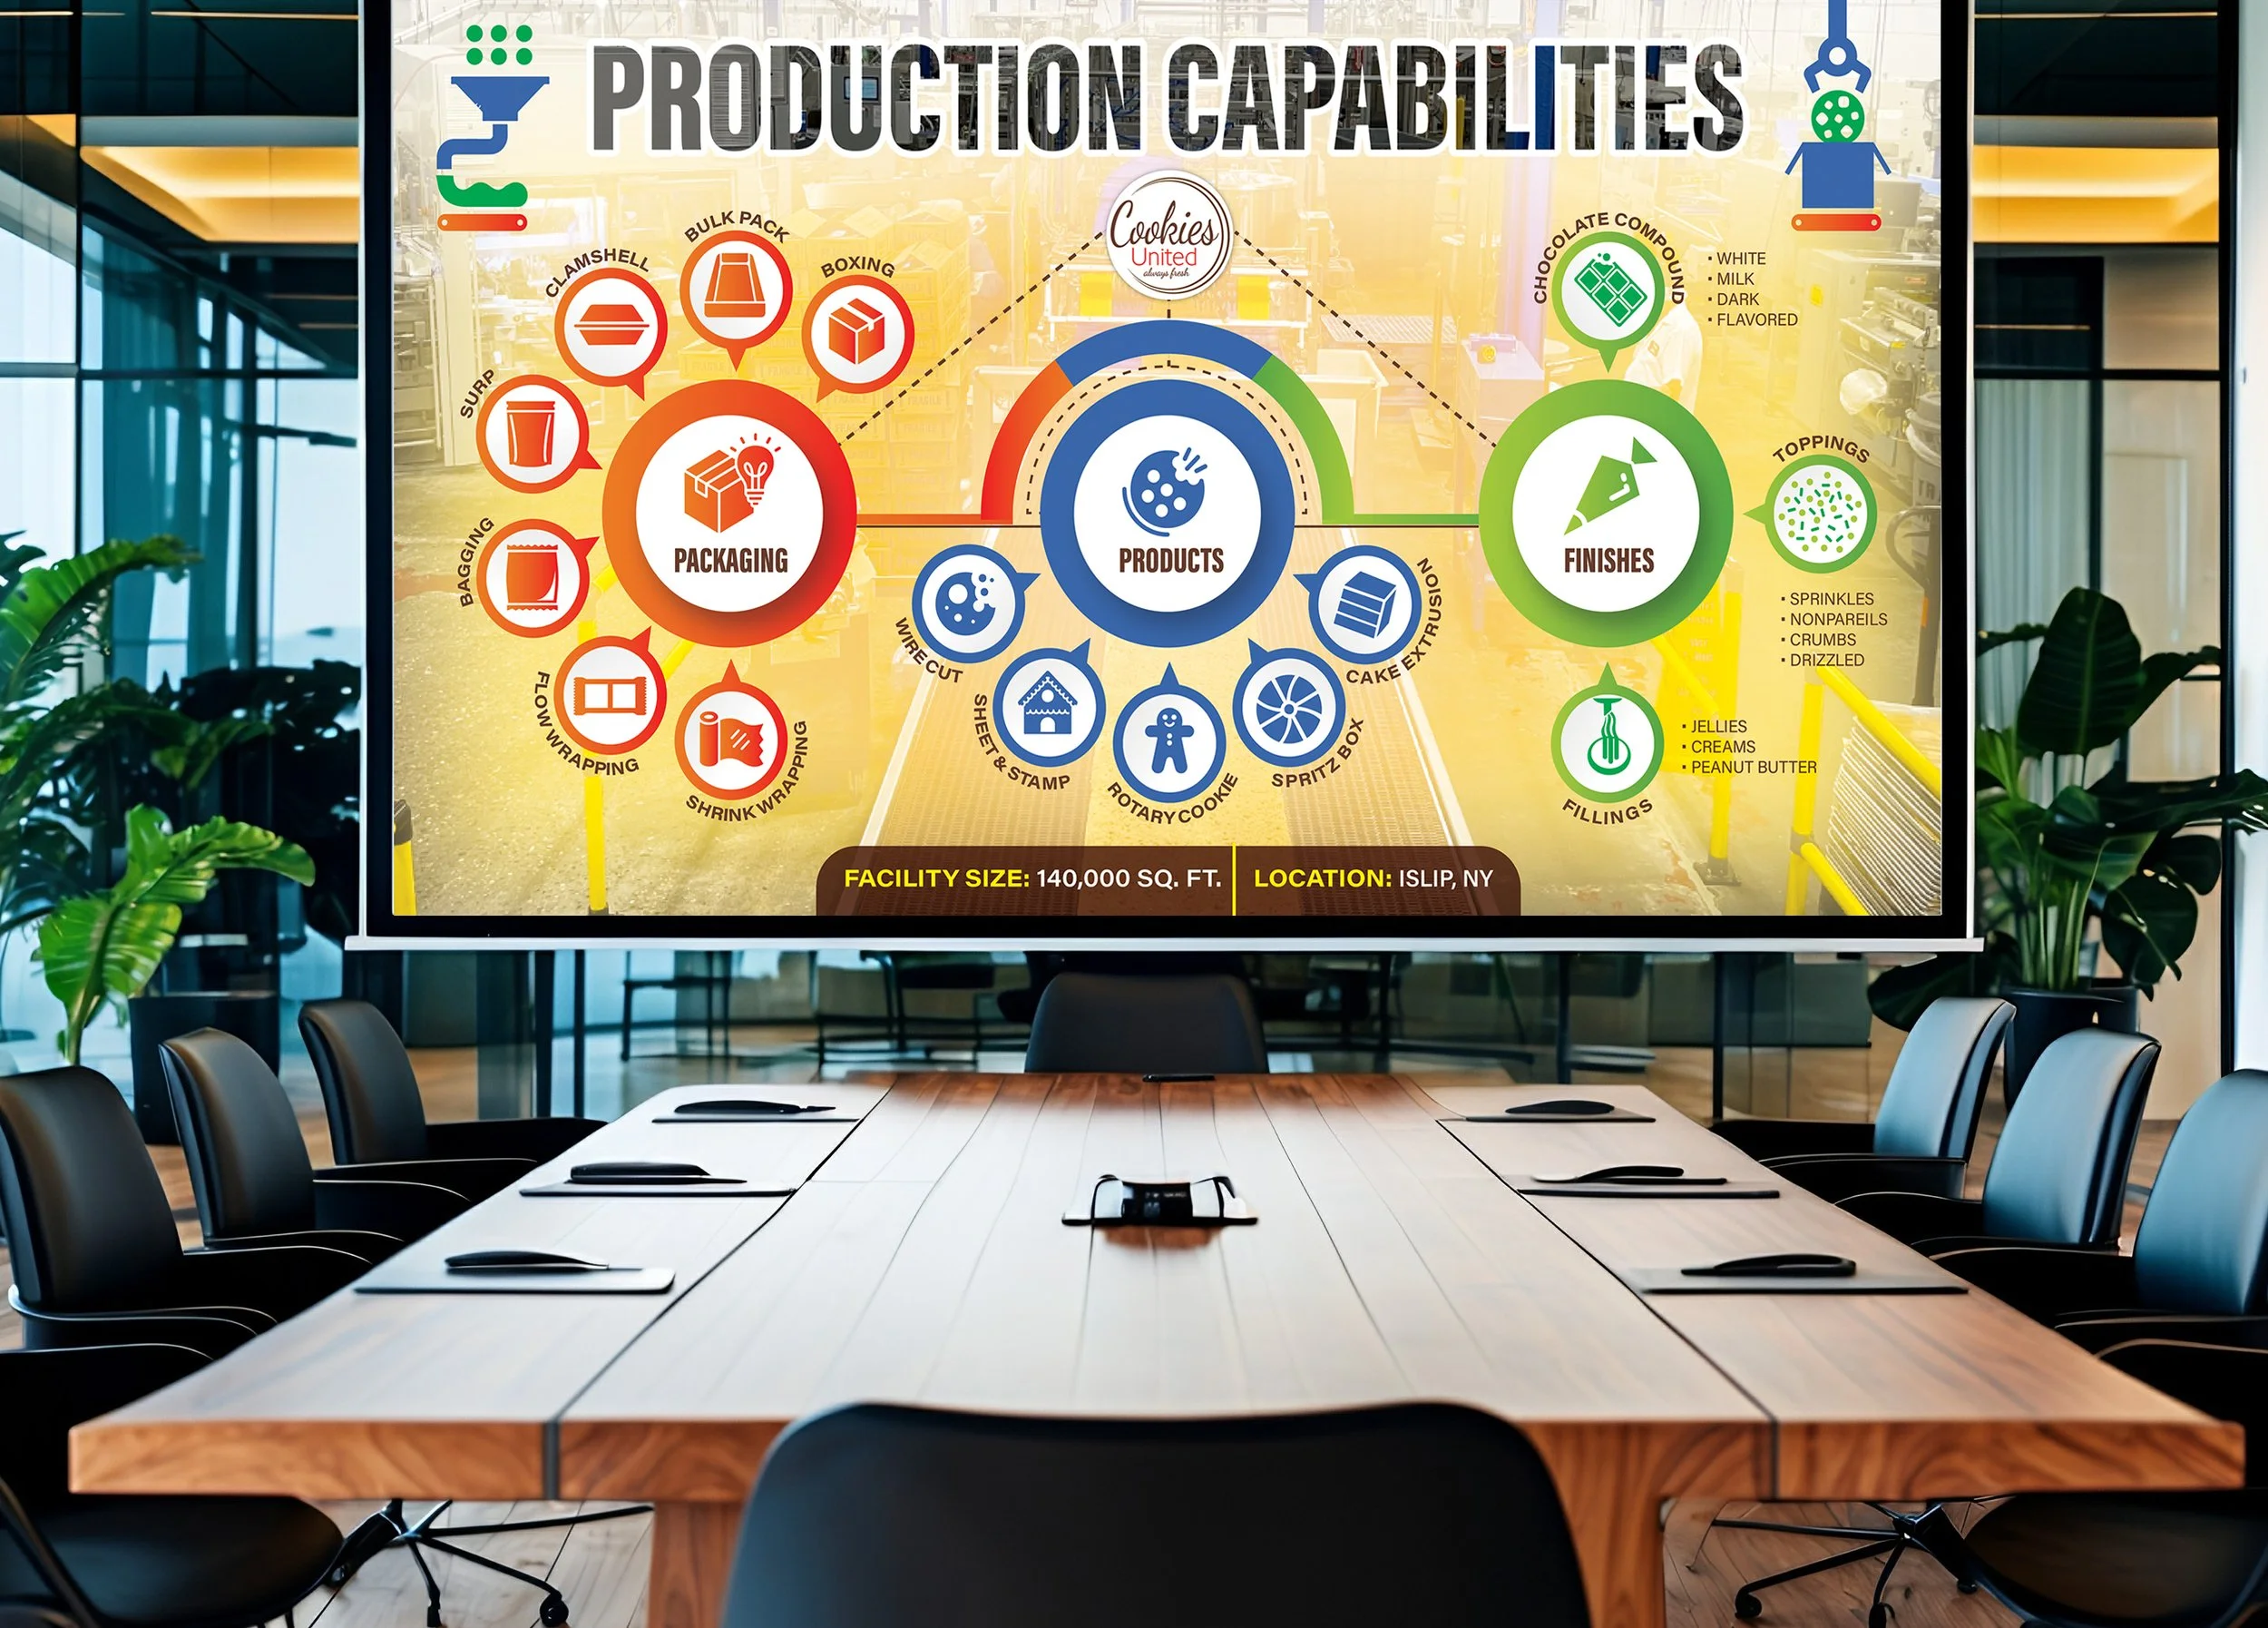
The Craft: Everything is built from scratch in Illustrator, focusing on clean layouts, smart typography, and custom icons or vector graphics that guide the viewer’s eye right to the key takeaways.
The Hand-Off: We’ll collaborate on review PDFs to make sure the flow is perfect, and when it’s locked in, you get a crisp, high-res PDF or digital file ready for web, print, or presentation decks.